Geospatial Intelligence Platform

Get Premier Land Assessments Today

Professional site intelligence for every land decision. Snapshot evaluates any U.S. parcel across environmental risk, power infrastructure, regulatory constraints, and resource potential — the same diligence criteria used by Fortune 500 site selectors — delivering a comprehensive feasibility report with multi-dimensional scoring in under 60 seconds.

See How It Works
Aerial view of land parcels
3
Scored Models
20+
Data Sources
300
Scoring Points
<60s
Instant Reports

See Snapshot in Action

Environmental, infrastructure, and regulatory screening — scored and mapped automatically.

Transforming How You Understand Land Value

Snapshot is transforming how people evaluate land for energy infrastructure development — giving buyers, sellers, investors, and developers the same intelligence that Fortune 500 companies use for site selection.

In today's rapidly evolving energy landscape — driven by unprecedented demand from energy infrastructure, AI computing facilities, and renewable energy projects — land with the right characteristics has become extraordinarily valuable.

Too often, critical site data is scattered across dozens of federal agencies, locked behind complex GIS tools, or only accessible to well-resourced teams with sophisticated site selection software.

Snapshot levels the playing field.

  • Understand any site's true potential See exactly what makes a property attractive to energy developers and infrastructure operators.
  • Access the same intelligence as the big players Environmental risk, infrastructure access, regulatory constraints, and resource potential — the same dimensions that drive billion-dollar site decisions.
  • Identify risks and opportunities instantly Fatal flaws, environmental constraints, infrastructure gaps, and solar potential — all in one report.
  • Make confident land decisions Whether you're buying, selling, investing, or developing — backed by comprehensive federal data screening.
SNAPSHOT | Property Evaluation Report
★★★★☆ TIER 4 — EXCELLENT
Demo site report map
Location 1847 Industrial Pkwy, Omaha, NE
Solar 82
Energy Infrastructure 74
Mineral 45
Transmission
Solar Resource
Flood Risk
Broadband
Geology
Groundwater
Key Findings
High-voltage transmission within 1.2 mi
Dakota Sandstone aquifer, moderate yield
2 MRDS deposits within 10 mi (copper, zinc)

Built for Every Land Decision

Whether you're buying, selling, investing, or developing — Snapshot gives you the data-driven intelligence to make confident decisions.

Land Buyers

Evaluate any parcel before committing. Identify fatal flaws, environmental risks, and infrastructure gaps that could derail your project — before you close. Snapshot gives you the same site selection intelligence used by Fortune 500 companies, so you know exactly what you're buying.

  • Avoid costly surprises with pre-purchase screening
  • Understand a site's energy development potential before negotiating
  • Identify deal-breakers that traditional due diligence misses

Land Sellers

Demonstrate your property's development potential with professional feasibility reports backed by federal data. In today's energy landscape, land with the right characteristics has become extraordinarily valuable. A strong Snapshot score gives you agency and a position of strength in negotiations with developers and utilities.

  • Prove your land's value with data developers already trust
  • Negotiate from a position of knowledge, not guesswork
  • Attract higher offers by quantifying energy infrastructure potential

Investors

Screen multiple sites quickly and compare scores side by side. Prioritize investments backed by federal data, not guesswork. Identify high-value properties before the competition and build a portfolio of sites with quantified development potential.

  • Rank and compare dozens of parcels in minutes, not weeks
  • Access the same sophisticated site selection tools as institutional players
  • De-risk land investments with comprehensive federal data scoring

Developers

Accelerate due diligence for solar farms, energy infrastructure, and energy infrastructure projects. Snapshot consolidates 20+ federal and public data sources into one actionable report, evaluating properties across power infrastructure, environmental risk, geology, water resources, and mineral potential. Reduce site evaluation from weeks to minutes.

  • Consolidate power infrastructure, environmental, and risk data in one place
  • Screen sites for fatal flaws before committing engineering resources
  • Generate professional reports to share with stakeholders and lenders

Three Scored Models + Resource Assessment

Every Snapshot report produces three 100-point scored assessments plus a qualitative water and geology resource evaluation — covering the full spectrum of site suitability questions.

Solar Compatibility Score

100-point assessment evaluating a site's viability for utility-scale solar development. Covers transmission access, solar resource quality, terrain feasibility, and environmental risk. Includes NRI and EPA modifiers.

  • Solar Irradiance (GHI, DNI, Latitude Tilt) — 15 pts
  • Transmission Line Proximity — 14 pts
  • Critical Habitat Clearance — 14 pts
  • Flood Zone Risk — 11 pts
  • Substation Access — 11 pts
  • Protected Area Status — 10 pts
  • Wetlands Presence — 9 pts
  • Land Use Classification — 6 pts
  • Terrain Slope — 5 pts
  • Gas Pipeline Proximity & Infra Density — 5 pts

Energy Infrastructure Suitability Score

100-point assessment optimized for energy infrastructure siting. Weights broadband connectivity, power redundancy, and flood resilience more heavily than solar. Includes NRI and EIA power plant modifiers.

  • Flood Zone Risk — 17 pts
  • Broadband / Fiber Availability — 15 pts
  • Substation Access — 12 pts
  • Critical Habitat Clearance — 10 pts
  • Transmission Access — 10 pts
  • Protected Area Status — 9 pts
  • Wetlands Presence — 8 pts
  • Land Use Classification — 7 pts
  • Gas Pipeline Proximity — 7 pts
  • Transmission & Substation Redundancy — 5 pts

Mineral Resource Score

100-point assessment of mineral and resource exploration potential. Combines geology, known deposit proximity, geochemical evidence, and historical mining activity into a prospectivity classification.

  • MRDS Deposit Proximity — 40 pts
  • Geology Prospectivity (lithology, age, rock type) — 30 pts
  • Geochemical Anomalies (NURE stream sediments) — 20 pts
  • BLM Mining Claims (active + historical) — 10 pts
💧

Water & Geology Assessment

Qualitative resource evaluation (not numerically scored) providing subsurface context for any development type. Covers aquifer mapping, groundwater conditions, water quality, geological formations, and structural setting.

  • Principal Aquifer (name, rock type, yield potential)
  • Groundwater Depth, Trend, and Confidence
  • Water Quality (conductivity, pH, dissolved solids)
  • Surface Geology (formation, age, lithology)
  • Subsurface Stratigraphy (Macrostrat column)
  • Structural Context (faults, lineations within 10 mi)

Comprehensive Site Intelligence

Every data layer you need to evaluate a site — queried, scored, and summarized automatically.

Power Infrastructure
Transmission lines, substations, and gas pipelines with voltage classification, distance calculations, and redundancy screening for interconnection planning.
Solar Resource
NREL solar irradiance data (GHI, DNI, latitude tilt) combined with slope and terrain screening to quantify energy generation potential.
🌳
Environmental Risk
Critical habitat, wetlands, flood zones, protected areas, and EPA contamination sites — identifying permitting risks and fatal flaws early.
Geology & Minerals
Surface and bedrock geology, mineral deposit proximity, geochemical anomalies, BLM mining claims, and prospectivity classification.
💧
Water Resources
Aquifer mapping, groundwater depth and trends, water quality parameters, and well monitoring data from USGS observation networks.
📡
Broadband & Connectivity
Fiber availability, served-location counts, and provider coverage from the FCC Broadband Data Collection ArcGIS layer — critical for energy infrastructure siting.
Natural Hazard Risk
FEMA National Risk Index with expected annual loss, social vulnerability, community resilience, and the top hazards by county.
🌐
Soils & Land Use
USGS Annual NLCD 2024 land classification, SSURGO soil drainage and farmland class, and terrain slope screening for construction feasibility.

Three Steps to Site Intelligence

From address to actionable report in under a minute.

01
Enter an Address
Type any US address or paste coordinates. Snapshot geocodes the location and builds report buffers automatically.
02
Report Runs
20+ federal and public data sources are queried simultaneously. Three scoring models evaluate the site for solar, energy infrastructure, and mineral potential.
03
Get Your Report
Receive a full PDF report card with scores, fatal flaws, environmental data, and a site map — ready to share.

The Snapshot Tier Rating System

Every property receives a tier rating from 1 to 5 based on its overall suitability for energy infrastructure development. The tier system provides an at-a-glance assessment that summarizes dozens of individual data points.

5
EXCEPTIONAL

Average score 86+. Excellent infrastructure access, minimal environmental constraints, strong resource potential. Site is development-ready with no significant barriers across solar, energy infrastructure, or mineral dimensions.

4
EXCELLENT

Average score 71-85. Strong infrastructure proximity and favorable environmental profile with minor limitations. May have moderate distance to transmission or partial environmental overlap requiring further review.

3
GOOD POTENTIAL

Average score 51-70. Mixed results across categories. Notable constraints in some areas (environmental overlap, moderate infrastructure distance, or elevated hazard risk) balanced by strengths in others.

2
LIMITED POTENTIAL

Average score 26-50. Significant constraints across multiple categories. Limited infrastructure access, elevated environmental risk, or poor resource potential. Development possible but with substantial additional investment.

1
NOT RECOMMENDED

Score below 26 or fatal flaw detected. Disqualifying conditions identified: inside flood hazard area, within critical habitat, no grid connection within reasonable distance, inside protected wilderness, or other insurmountable barriers.

Detailed Land Evaluation

Every report includes a multi-page PDF with tier ratings, three 100-point scoring models, geology and water resource context, mineral potential assessment, geospatial maps, environmental findings, and AI-generated site narratives — ready to share with stakeholders, lenders, or your team.

Site Feasibility Report
Site Feasibility
Report
Property 1847 Industrial Pkwy, Omaha, NE 68138
Coordinates 41.2795 N, -95.9313 W
Report Date March 2, 2026
Report ID SNP-2026-00847
4
Tier 4 — Excellent
★★★★☆
82
Solar Score
74
Energy Infrastructure Score
45
Mineral Score
Map & Score Breakdown
Site Map
Site report map
Score Breakdown
Solar Score — 82/100
Solar Resource (15 pts)12
Transmission (14 pts)14
Critical Habitat (14 pts)14
Substation (11 pts)9
Flood Zones (11 pts)11
Protected Areas (10 pts)10
Wetlands (9 pts)7
Land Use / CDL (6 pts)3
Slope (5 pts)5
Gas Pipelines (3 pts)0
Infra Density (2 pts)0
NRI Adjustment-3
Energy Infrastructure Score — 74/100
Flood Zones (17 pts)17
Broadband / Fiber (15 pts)10
Substation (12 pts)9
Transmission (10 pts)10
Critical Habitat (10 pts)10
Protected Areas (9 pts)9
Wetlands (8 pts)6
Land Use / CDL (7 pts)4
Gas Pipelines (7 pts)0
Trans Redundancy (3 pts)2
Sub Redundancy (2 pts)0
NRI Adjustment-3
Findings
Power Infrastructure
Nearest Transmission Line 345 kV — 1.2 mi NW
Nearest Substation 3.4 mi SE
Gas Pipeline 2.1 mi E
Infrastructure Density High — 7 features within 5 mi
Environmental Screening
USFWS Critical Habitat None Found
NWI Wetlands 0.8% of buffer — Freshwater Emergent
PAD-US Protected Areas None Found
FEMA Flood Zone Zone X — Minimal Risk
Solar Resource (NREL NSRDB)
Global Horizontal Irradiance 4.92 kWh/m²/day
Direct Normal Irradiance 5.18 kWh/m²/day
Latitude Tilt Irradiance 5.34 kWh/m²/day
Land Use & Soils (Annual NLCD 2024 / SSURGO)
Land Cover (Annual NLCD 2024) Cultivated Crops — Corn/Soybean
Farmland Classification Prime Farmland
Soil Drainage Class Well Drained
Geology & Mineral Resources
Formation Dakota Sandstone (Cretaceous)
Lithology Sandstone, Siltstone, Shale
Prospectivity Moderate
MRDS Deposits 2 within 10 mi (copper, zinc)
Geochemical Anomalies Cu elevated (142 ppm, 3 samples)
Water Resources
Principal Aquifer Dakota Sandstone Aquifer
Yield Potential Moderate (sandstone)
Depth to Water ~62 ft (Moderate)
Water Level Trend Stable
Nearby Monitoring Wells 4 within 20 mi
Risk & Recommendations
FEMA National Risk Index
Overall Risk Rating Relatively Low
Expected Annual Loss $1.2M / county
Social Vulnerability Relatively Moderate
Community Resilience Relatively High
Top Hazards Tornado, Hail, Ice Storm
Fatal Flaws
0 Fatal Flaws

No disqualifying conditions detected. Site is clear for further due diligence.
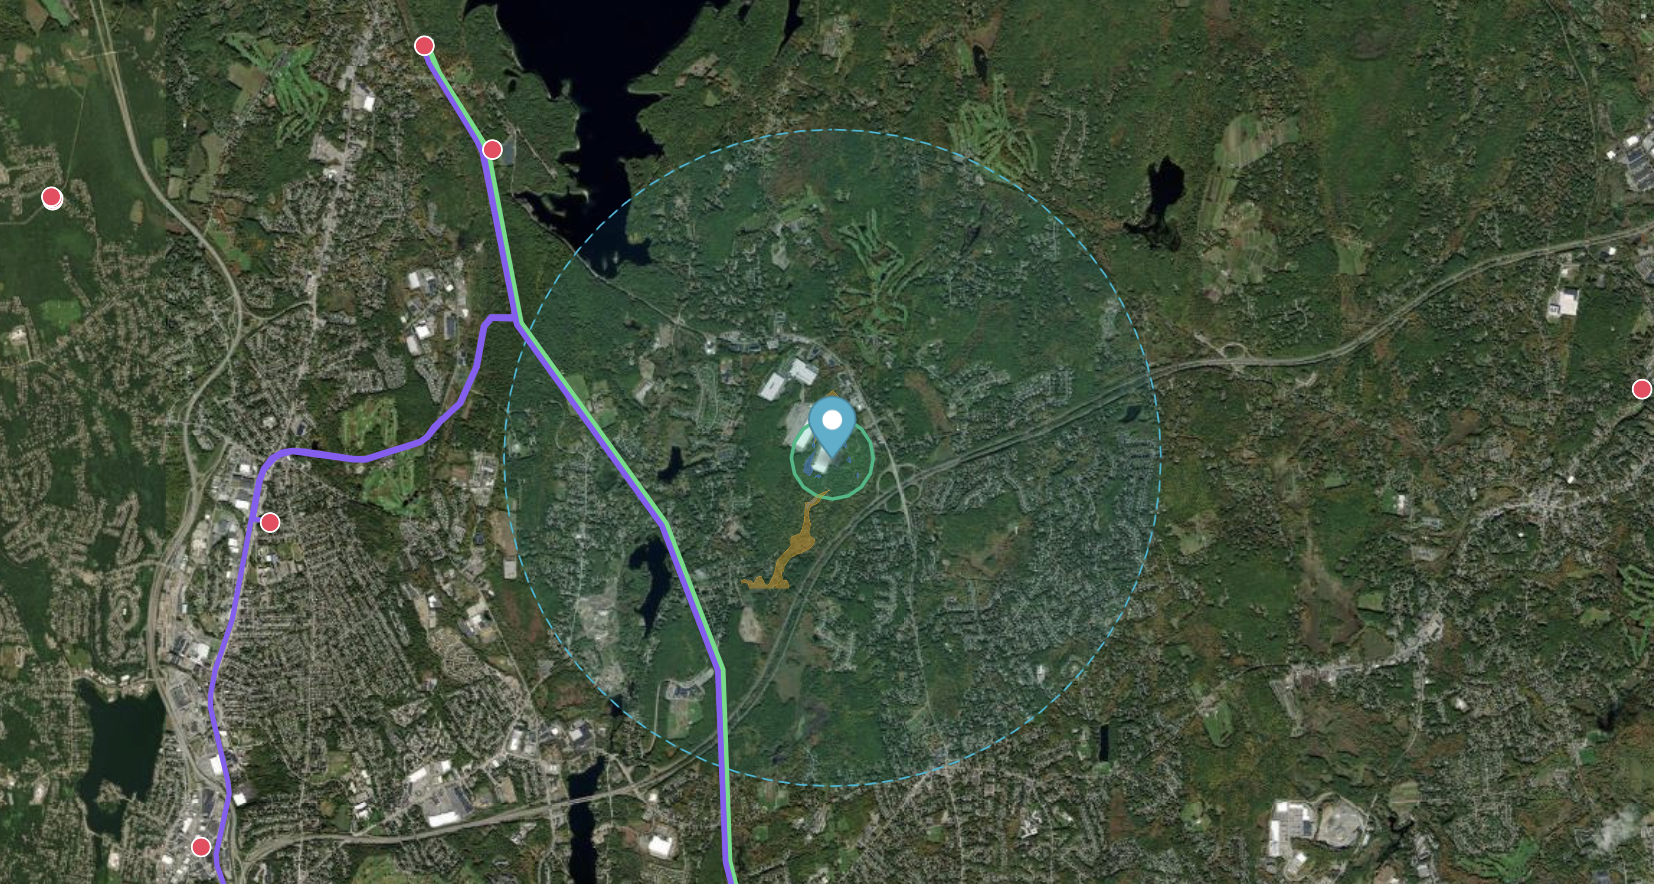
1 Warning

Minor wetland presence (0.8%) in the screening buffer — may require delineation survey.

Recommendation
Proceed with Phase 2 Due Diligence. This site scores well for solar (82/100) and energy infrastructure (74/100) development, with moderate mineral potential (45/100). No fatal flaws detected. Geology indicates Dakota Sandstone with moderate aquifer yield. Recommended next steps: title search, wetland delineation, utility interconnection study, and Phase I ESA. The minor wetland presence should be characterized early.
Data Sources
ESRI/HIFLD (Transmission, Substations, Gas Pipelines) FEMA (Flood Zones, National Risk Index) USFWS (Critical Habitat, Wetlands) NREL (Solar Resource, NSRDB) USGS (Protected Areas, 3DEP Elevation, SGMC Geology, Macrostrat, MRDS Minerals, NWIS Groundwater & Water Quality, Principal Aquifers) USGS / USDA (Annual NLCD 2024 Land Use, SSURGO Soils) EPA (Brownfields, Superfund) Esri / EIA (Power Plants in the US) FCC (National Broadband Map) BLM (Mining Claims, Land Status) NURE (Stream Sediment Geochemistry)

Powered by Authoritative Federal Data

Every data layer is queried in real time from official government APIs. Snapshot aggregates data from these trusted sources into one actionable report.

Esri Esri ArcGIS Power Infrastructure, Transmission, Substations, Pipelines FEMA FEMA Flood Zones, National Risk Index USFWS USFWS Wetlands, Critical Habitat NREL NREL Solar Irradiance, NSRDB USGS USGS Protected Areas, Elevation, Geology, Mineral Deposits, Groundwater, Water Quality USDA USDA Soils, Farmland Classification, Annual NLCD 2024 Land Use EPA EPA Brownfields, Superfund Sites EIA EIA Power Plants, Generating Capacity FCC FCC Broadband Coverage, Fiber Availability BLM BLM Mining Claims, Land Status

Professional Site Intelligence at a Fraction of the Cost

A GIS analyst charges $300 – $1,200 per site assessment. Snapshot delivers a comparable report in under 60 seconds.

Free Preview
$0
1 complimentary assessment
  • Summary scores (Solar + DC + Mineral)
  • Interactive map view
  • Experience the full report depth
  • No credit card required
Single Report
$50
per assessment
  • Complete site assessment with full breakdowns
  • Fatal flaw and risk flag detection
  • Professional PDF report
  • Interactive map with all layers
  • Score history saved to account
Unlimited
$300/mo
unlimited assessments
  • Everything in 5-Pack
  • Batch reports (upload parcel lists)
  • API access for integrations
  • White-label report option
  • Priority direct support

Need deeper diligence? Our Enhanced Site Survey adds state-level, county-level, and manually-researched intelligence to any assessment — starting at $500.

Contact us to learn more →

Frequently Asked Questions

Each assessment evaluates a site across nine dimensions: power infrastructure proximity (transmission lines, substations), environmental risk (flood zones, wetlands, critical habitat), solar resource potential, terrain and slope, land use and soil classification, protected area status, broadband connectivity, natural hazard exposure, and contamination risk. The result is a multi-dimensional suitability score with full category-by-category breakdowns.

Snapshot sources data from authoritative federal agencies including USGS, FEMA, USFWS, NREL, USDA, EPA, EIA, and FCC. Every score is fully transparent — you can see exactly which data contributed which points. Federal datasets are typically updated monthly to annually. For high-value decisions, we recommend verifying critical findings through professional due diligence, which our Enhanced Site Survey can provide.

Most tools focus on 3–5 data categories or provide black-box valuations without showing their work. Snapshot evaluates sites across all nine assessment dimensions simultaneously, with fully transparent scoring — every point is traceable to a specific dataset and threshold. You see the report evidence and scoring, not just the answer.

Snapshot produces three scored assessments per site: Solar Development Compatibility (100-point scale), Energy Infrastructure Suitability (100-point scale), and Mineral Resource Potential (100-point scale). Whether you're screening for solar farms, energy infrastructure sites, mineral exploration, real estate investment, or evaluating a lease offer on your land — Snapshot provides the report you need.

Paid assessments include a professional PDF report with maps and full score breakdowns. The 5-Pack and Unlimited tiers also include Excel spreadsheets, GeoJSON (for GIS software), and CSV data exports. All reports are saved to your account for future access.

Yes. Our Enhanced Site Survey adds state-level, county-level, and manually-researched intelligence that the automated report cannot reach — including utility interconnection status, county zoning verification, tax incentive programs, environmental permitting pathways, and more. Enhanced Surveys start at $500 and are available after any paid assessment. Contact us to learn more.

Yes. All data is transmitted over encrypted connections (HTTPS/TLS). Your account and report history are stored on Google Firebase with enterprise-grade security. API keys are never exposed to your browser. You can only access your own data, and you can request deletion at any time. See our Privacy Policy for full details.

Yes, anytime. Cancel through your billing portal and your access continues through the end of your current billing period. No long-term contracts, no cancellation fees. Single Reports and 5-Packs are one-time purchases with credits that never expire.

Ready to Assess a Site?

Start with a free assessment — no credit card required.